The conventional wisdom used to be simple: put pucks on net, good things happen. Coaches preached it. Beat reporters tracked it. Broadcasters and fans alike treated shot differentials like a scoreboard. And for a long time, it made sense. Teams that outshot their opponents usually won.
But something has shifted. Over the last six seasons, the NHL has quietly been taking fewer shots on goal. Not because teams are playing worse offense, quite the opposite. The league has gotten more selective, more deliberate, and as a result, more efficient. The raw numbers tell a story that most people, outside of the analytics community, haven’t noticed yet.
Shot Volume Is Down
League-wide shots on goal per game have declined steadily since 2020-21. The drop isn’t dramatic in any single season, but across six years it adds up to a meaningful trend.
NHL Average Shots on Goal Per Game by Season
Just over 7 fewer shots on goal per game this season compared to 2021-22. That’s no coincidence, it’s a structural change in how the game is being played, and one that the sharpest players, coaches, and front offices are taking advantage of.
But Shooting Percentage Is Up
Here’s where it gets interesting. If teams are shooting less, you might expect scoring to fall with it. Instead, shooting percentage has climbed over the same window.
League-Average Shooting % by Season
More than a full percentage point of shooting percentage gained in six years. Teams are converting on a higher share of the shots they do take, which means the shots they’re choosing to take are the more dangerous ones.
The Shift Toward High-Danger
The underlying cause is a quiet but decisive shift in where teams are shooting from. High-danger shot attempts, those from the slot and near the crease, have grown as a share of total offense, while perimeter and point shots have declined.
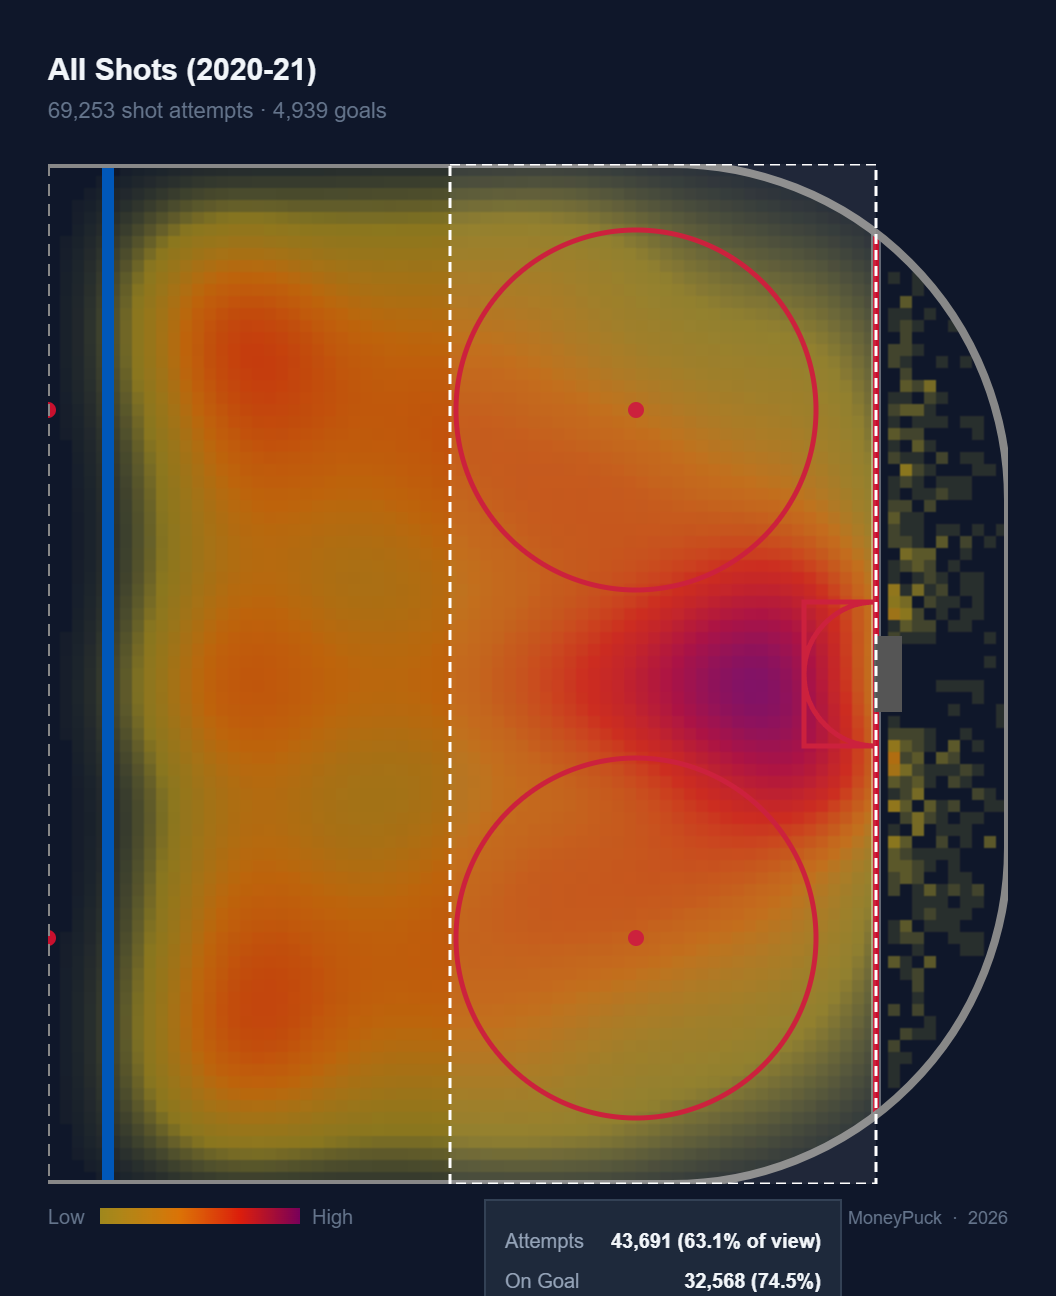
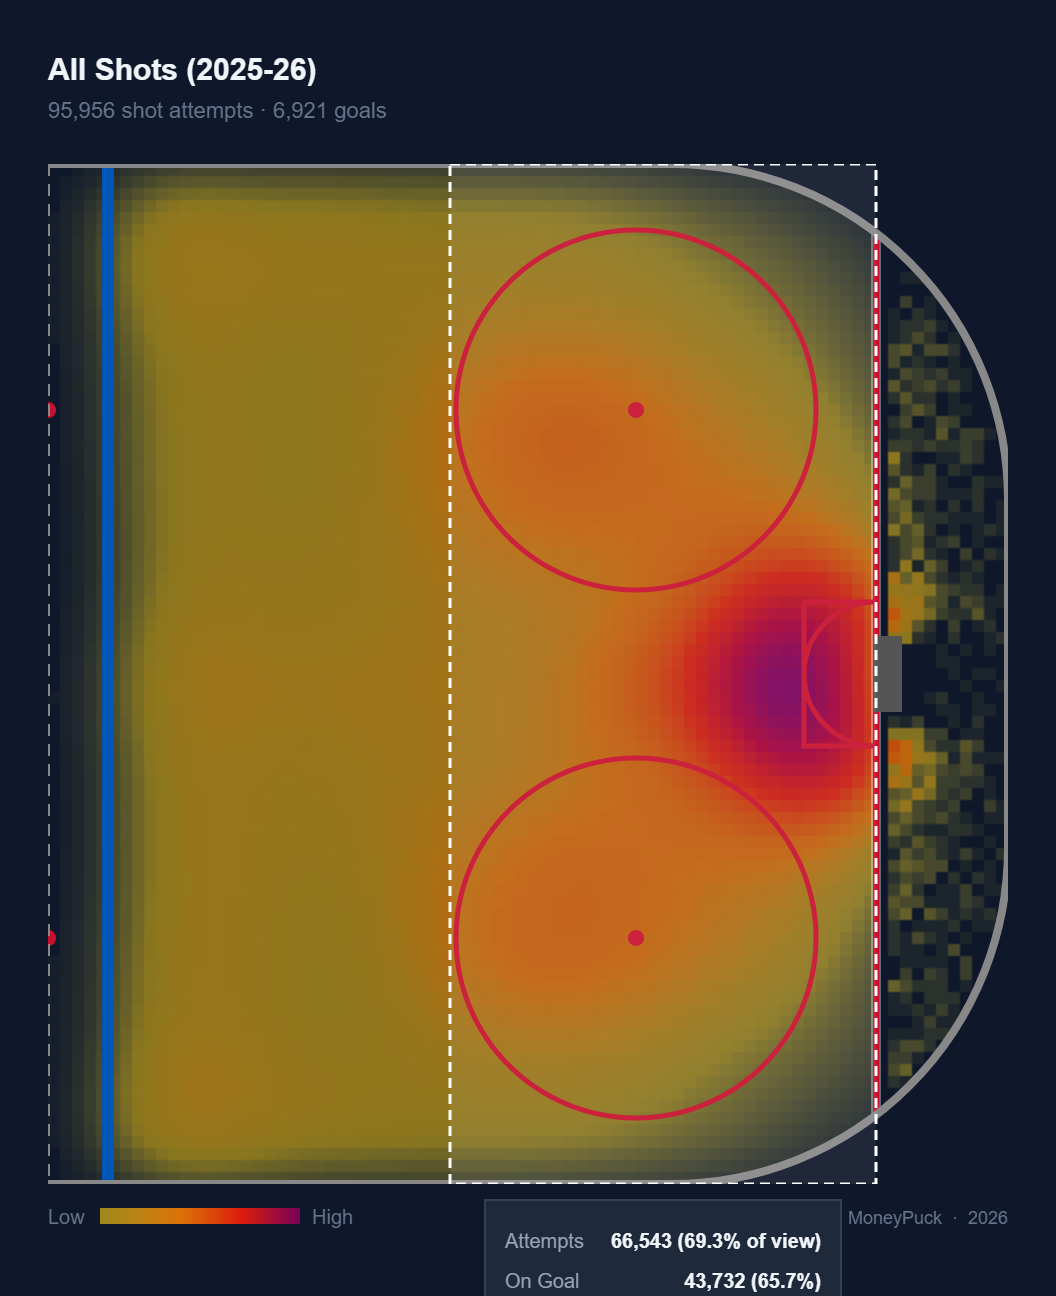
From the 2020-21 season to the 2025-26 season, the percentage of shots taken from between the top of the faceoff circles and the goal line has increased from 63.1% to 69.3%, a 6.2 percentage point increase. Shots on goal from this area convert at roughly 13%, compared to 4-4.5% from between the blue line and the top of the circles, and that gap hasn’t meaningfully changed over this period. Teams have simply gotten better at seeking out the higher-percentage areas of the ice.
Death of the Point/Slap Shot
Many NHL blue lines emphasized defensemen who were not only able to take hard slap shots from the point, but get them through. Players like Shea Weber, Zdeno Chara, and PK Subban were a premium in the 2010s.
Today, the premier defensemen in the NHL are those that can scan the ice, move the puck to the high danger zones, or shoot a wrist shot through traffic for a tip at an elite level. There is a reason why the league’s top defensemen: Cale Makar, Quinn Hughes, Zach Werenski, etc. all share a similar archetype.
Due to this, we have seen a dramatic decrease in shots taken from the point, as well as slapshots taken. This is simply because, on average, they yield lower expected goals compared to taking shots closer to the net or ones that are easier to deflect.
NHL Point Shot Attempts % by Season
Point shots are considered ones taken between the blue-line and top of the faceoff circles.
Why Is This Happening?
The data shows a clear shift, but pinning down a single cause is harder than it looks. The most likely explanation is a gradual, league-wide adoption of shot quality thinking at the coaching and front office level. Shot quality metrics have been publicly available for over a decade, and as analytics departments have expanded across the league, those findings have slowly made their way into how teams structure their offense and what they ask their players to prioritize on the ice.
The timing aligns. The cohort of coaches who treated shot volume as a primary offensive metric is being replaced by staff who are fluent in xG and enchanced shot location data. The playbook has changed, slowly but steadily.
That said, correlation isn’t causation, and pinpointing exactly why teams are shooting from better spots is difficult without being able to look into coaching systems and practice structures that aren’t captured in public data. What the data can tell us clearly is that the shift is real. It is consistent across the league, and it’s showing up in the data.
What This Looks Like Team-by-Team
The trend is league-wide, but the spread between teams is significant. Some franchises have leaned into shot quality for years. Others have built their offense around volume and forechecking pressure. Both can work, and the data makes that nuance visible.
Let’s take the Montreal Canadiens and the Carolina Hurricanes as two examples:
As of the recording of this data, both teams have played 71 games this season and have scored nearly identical goal totals within the offensive zone at 5-on-5, Montreal at 163, Carolina at 157.
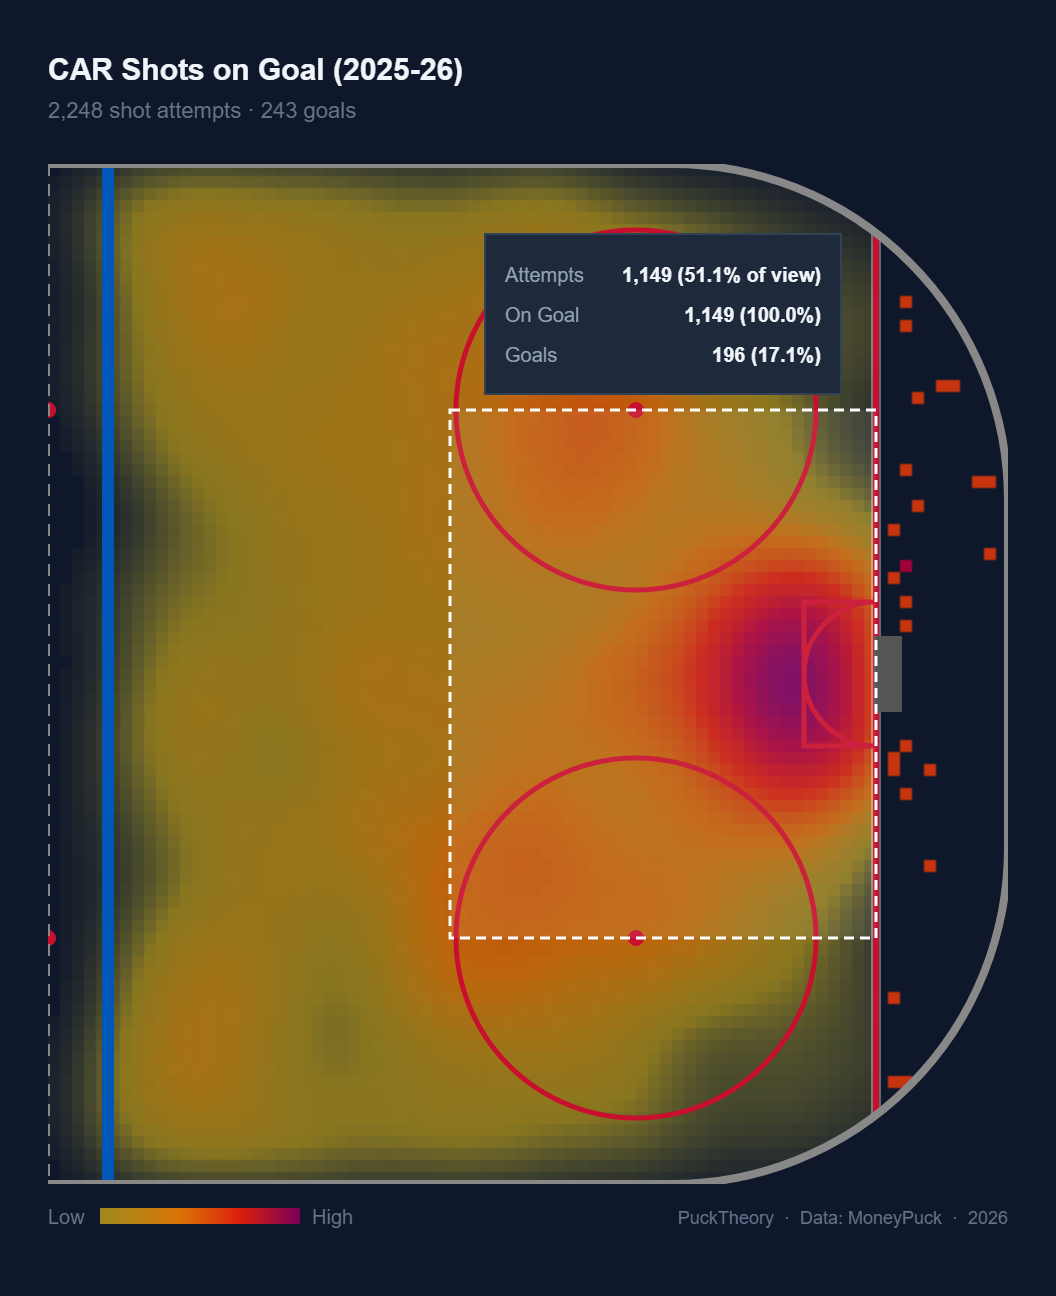
What’s striking is how they got there. When playing at 5-on-5, the Hurricanes have generated 368 more shots on goal than the Canadiens over the course of the season, yet Montreal has scored slightly more goals. Carolina has built their offensive identity around relentless forechecking and sustained zone pressure. They focus on generating volume, and even if that volume isn’t always the most dangerous on its own, it wears teams down, creating opportunities through sheer persistence. It’s a deliberate system that coach Rod Brind’Amour has deployed for years, and it works.
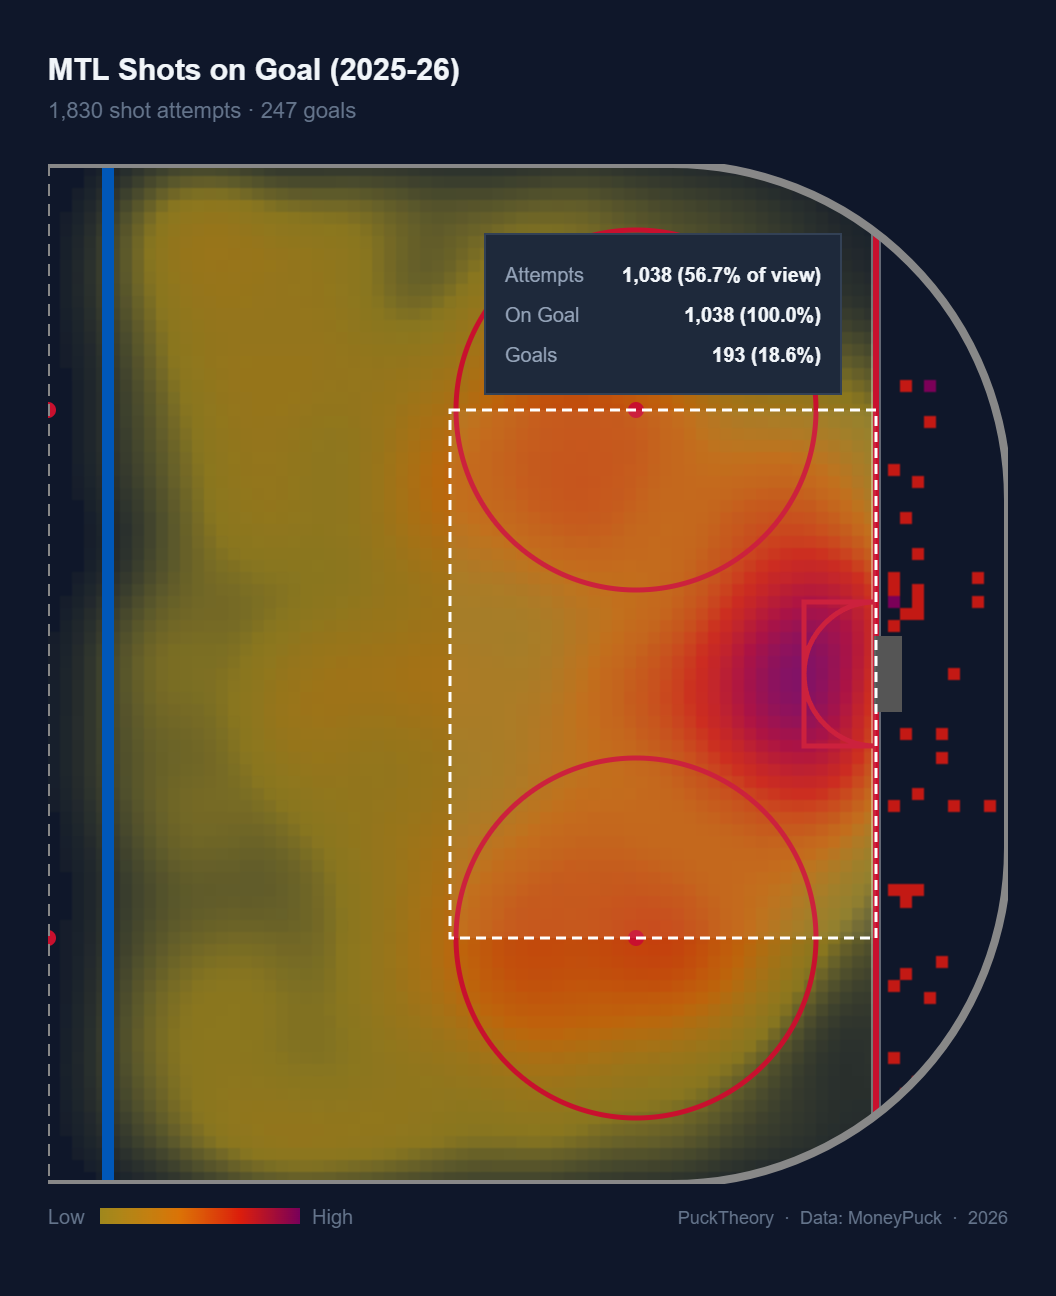
Montreal is arriving at almost the same destination via a different route. Looking at the heatmaps, the Canadiens show a noticeably lower concentration of shots from the point and a higher concentration from within the faceoff circles and around the net. Those are higher-percentage looks, which the numbers reflect.
The defenseman shot data only emphasizes the contrast. Carolina’s defensemen account for 732 of their 2,341 shots on goal this season (31.3%), compared to 519 of Montreal’s 1,917 (27.1%) (via NHL.com). Carolina’s blue line is actively feeding the volume; Montreal’s is more conservative from distance and distributing the puck down low.
There’s no objectively wrong answer here. Both teams are scoring at nearly identical rates. But that’s exactly the point. Raw shot totals alone don’t tell you how dangerous an offense is. Montreal doesn’t need Carolina’s volume because their shots are coming from better real estate. Understanding the difference between these teams and their offensive philosophies is what separates a meaningful offensive evaluation from one that just counts attempts and goals.
You can explore the data yourself using the Shot Heatmap tool - filter by team, player, shot type, season, etc., and watch where the shot density shifts on the ice.
The Implication for How We Evaluate Offenses
If the league is getting more selective, then raw shot totals are becoming an increasingly poor proxy for offensive quality. A team sitting at 28 shots per game might be running a more dangerous offense than one at 34, if those 28 shots are coming from better locations.
This matters for how we evaluate forwards, defensemen, and line combinations. A winger who takes 12 shots per 60 but 40% of them are from the slot is generating more real offense than one at 18 shots per 60 from the perimeter. Without location and context, shot totals don’t tell you much.
The coaches and front offices who internalized this first have had a multi-year head start, and now the rest of the league is catching up.
DISCLAIMER: All data is sourced via MoneyPuck as of 3/26/2026. Shot data included in this article is only including shots taken within the offensive zone and during the regular season. Empty net shots are excluded.